Earth and Environmental Science
Unit 1: The Earth in Space
|
The Earth, as we know it, is a wonderful place.
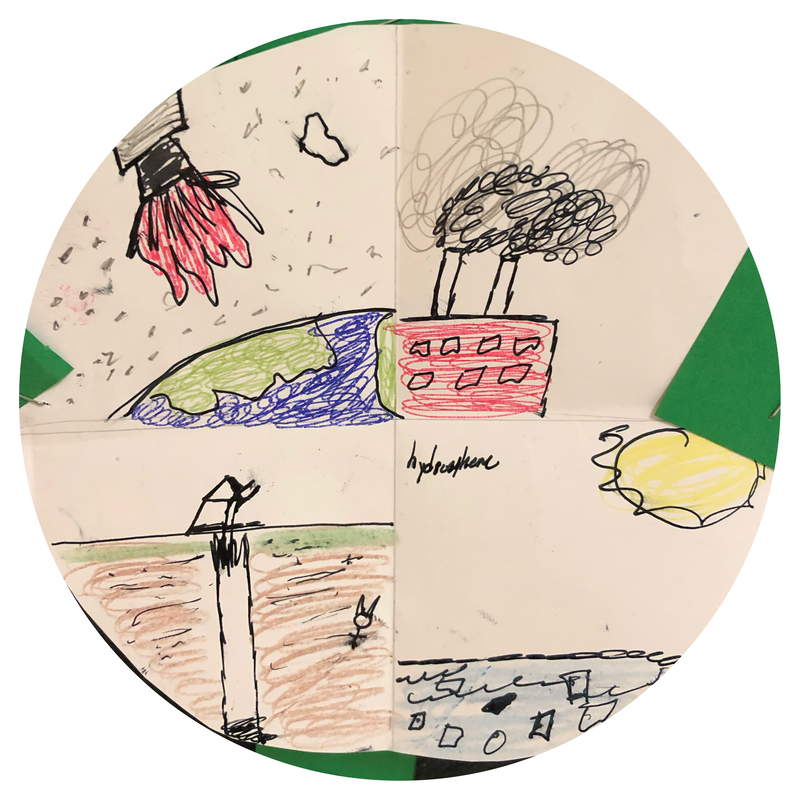
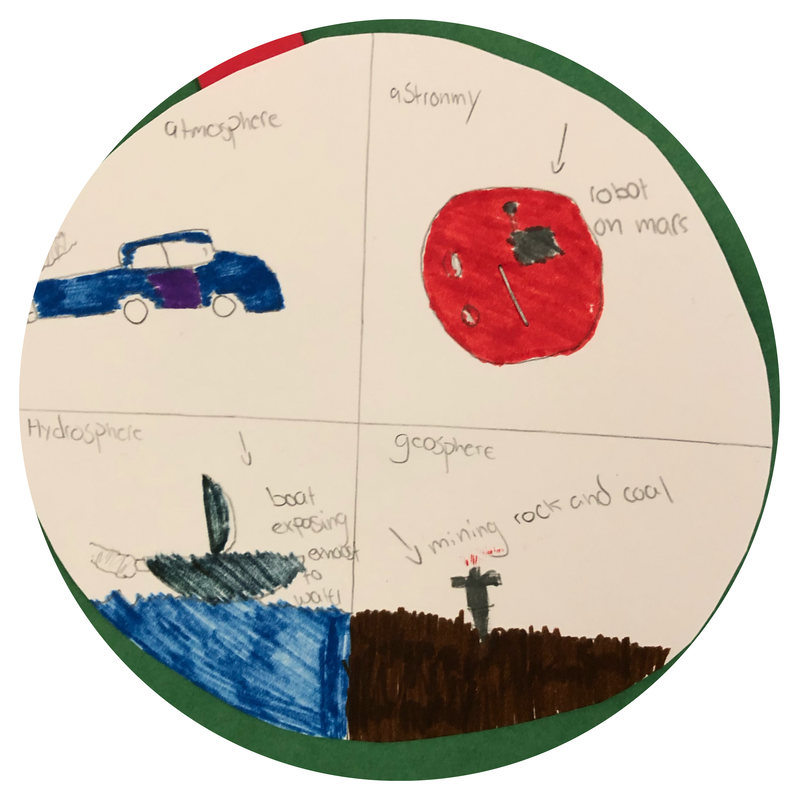
We typically picture the Earth as being made of four distinct parts: 1. space (astronomy), 2. the sky/atmosphere (meteorology), 3. the waters/hydrosphere (oceanography), and 4. the solid land/geosphere (geology). All of the things living on planet Earth make up the biosphere, and that of course includes humans! Interestingly enough, humans affect the other spheres more than any other living thing ever has or probably ever will. ANTHROPOGENIC factors are those things that happen to the environment because of humans, such as: littering, destruction of habitats for development, human-influenced global climate change due to the overconsumption of fossil fuels. It is important to keep in mind all of the effects our actions have on the planet and future generations of people. |
|

|
|
|
EEn.1.1.1 Explain the Earth’s motion through space, including precession, nutation, the barycenter, and its path about the galaxy.
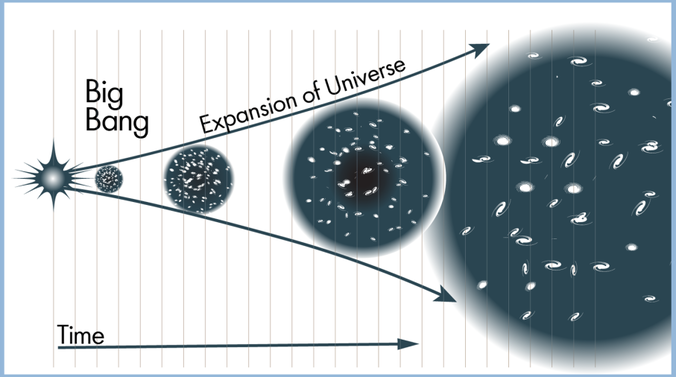
The Big Bang Theory says that at some point all matter in the universe was condensed into a small, dense ball of matter. An explosion occurred and triggered the expansion of the universe. Galaxies, solar systems, and planets are all slowly moving away from the center of the universe as it expands.
The evidence for this theory comes from using the Doppler effect and analyzing the colored shift that represents the direction of the motion of the objects. RED shift indicates objects that are moving away from us, while BLUE shift indicates objects that are moving toward us.
The evidence for this theory comes from using the Doppler effect and analyzing the colored shift that represents the direction of the motion of the objects. RED shift indicates objects that are moving away from us, while BLUE shift indicates objects that are moving toward us.
|
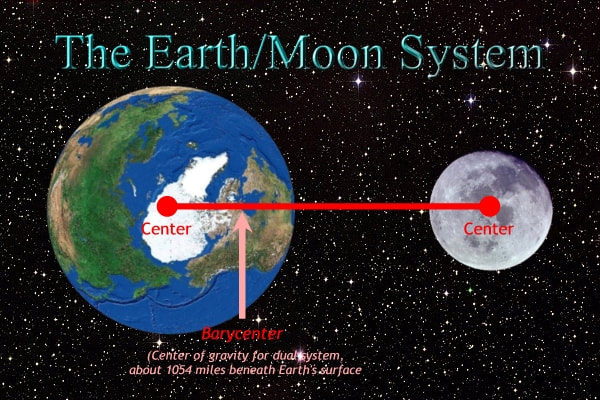
The barycenter is the center of balance between two objects. If two objects have about the same mass, the barycenter would be almost exactly in the middle of the area between the objects. However, if one object has much more mass than the other object, the barycenter is MUCH closer to the heavier object.
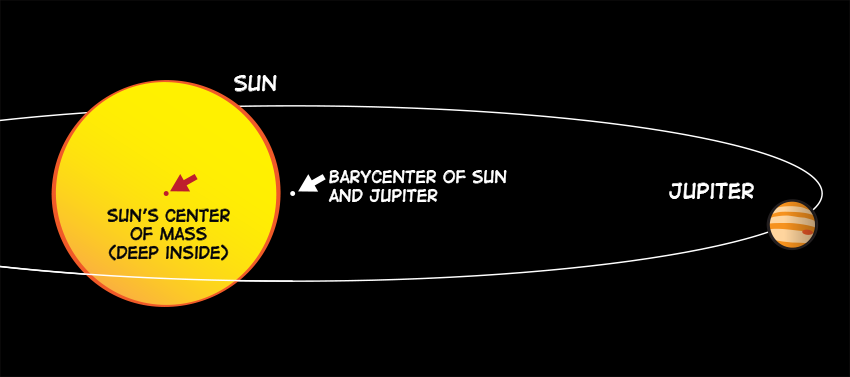
Remember, the Sun is not stuck in a fixed point within our solar system. It also revolves around a barycenter between it and the rest of the solar system.
|
|
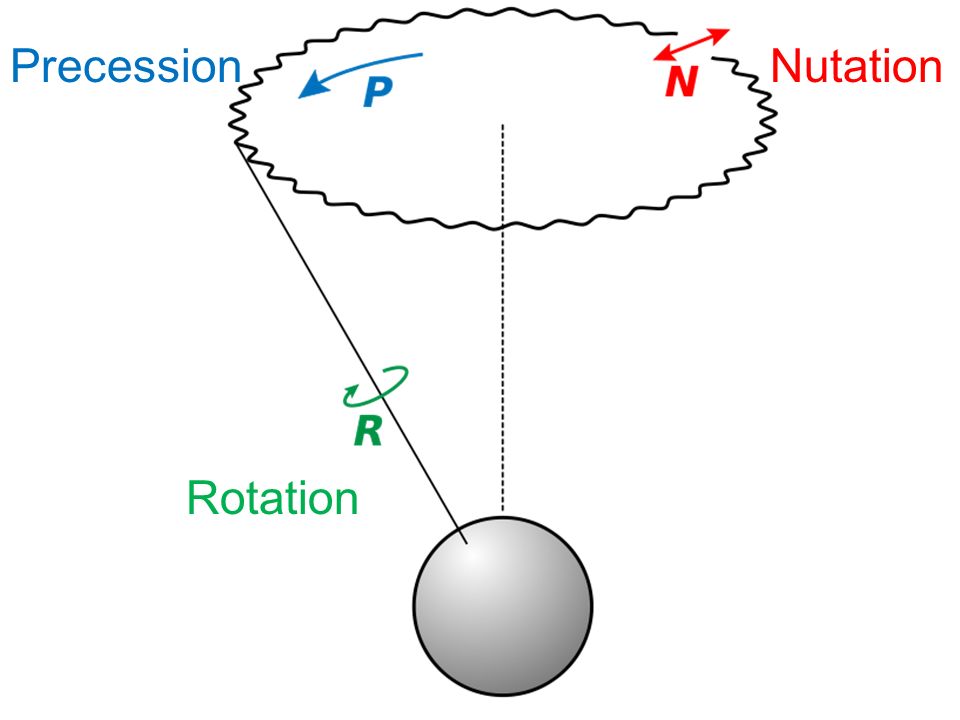
Precession occurs when the axis of the Earth points in a different direction over time without changing its angle of tilt (23.5 degrees). This results in different stars being seen from the point of view of the poles, but doesn't affect much else.
Nutation is the wobbling or nodding of the axis (changing it as much as 1/2 a degree over an 18 year period). It is caused by the moon's pull on the Earth and can result in slight seasonal effects.
Nutation is the wobbling or nodding of the axis (changing it as much as 1/2 a degree over an 18 year period). It is caused by the moon's pull on the Earth and can result in slight seasonal effects.
|
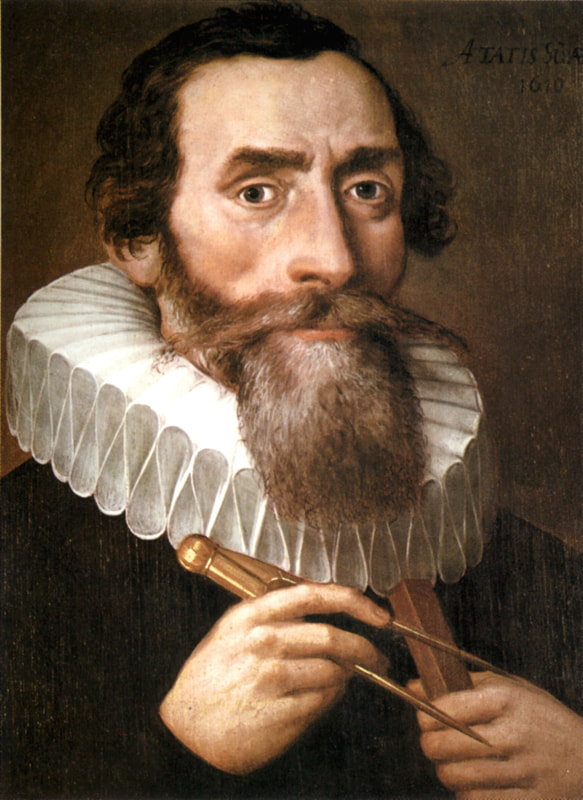
Kepler's Laws
1. Law of Ellipses: Every planet in the solar system moves around the Sun on an elliptical orbit. (Ellipses are like ovals.)
3. Law of Periods: Every planet's revolution (one trip around the sun) aka "year" increases as its distance from the sun increases. |
EEn.1.1.2 Explain how the Earth’s rotation and revolution about the Sun affect its shape and is related to seasons and tides.
|
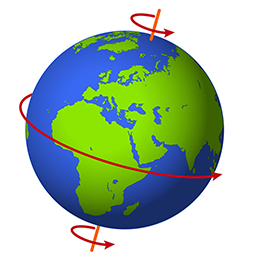
The Earth's ROTATION has one main effect on our planet: it determines the length of day and night we experience on Earth.
|
|
Why isn't the Earth a perfectly round ball?
You would think the Earth was just a perfect sphere like the globe that is often used to represent the planet. However, it's considered to be an oblate spheroid--which basically means it's fatter around the equator than it is from pole to pole. Think of a person who is wider than they are tall. Because of the Earth's spin and gravity pulling on the Earth from both the Sun and the Moon, the Earth has a bit of a bulge around its waist.
|
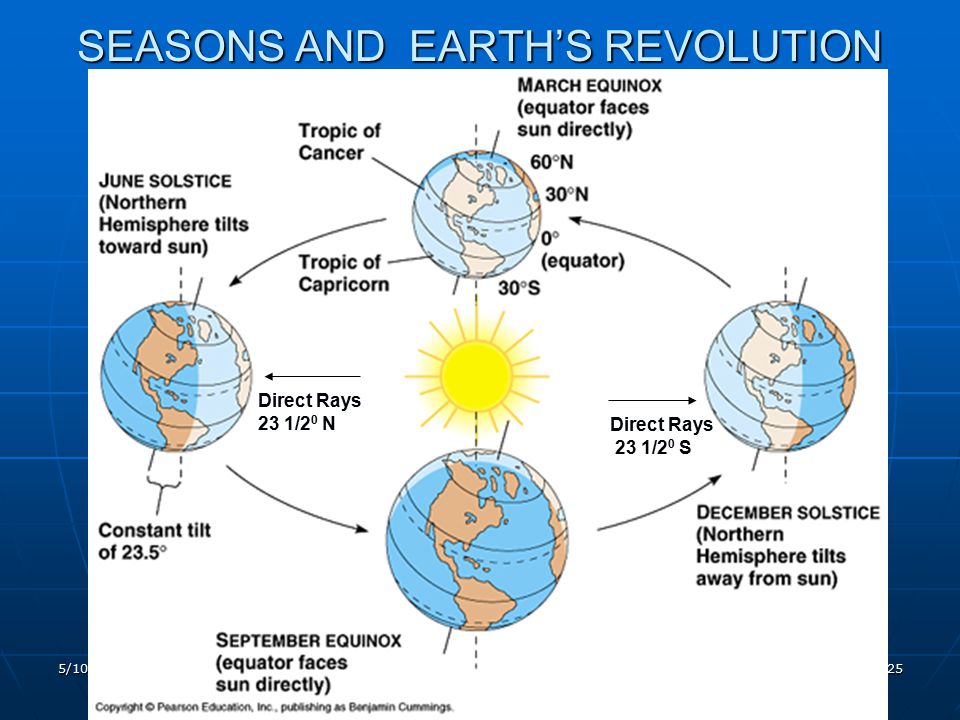
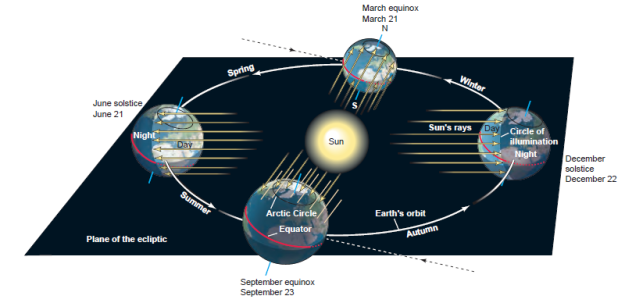
The Earth's REVOLUTION is a bit more significant. Because of the revolution AND tilt of the planet on its axis, we experience seasons.
|
What are Tides?
|
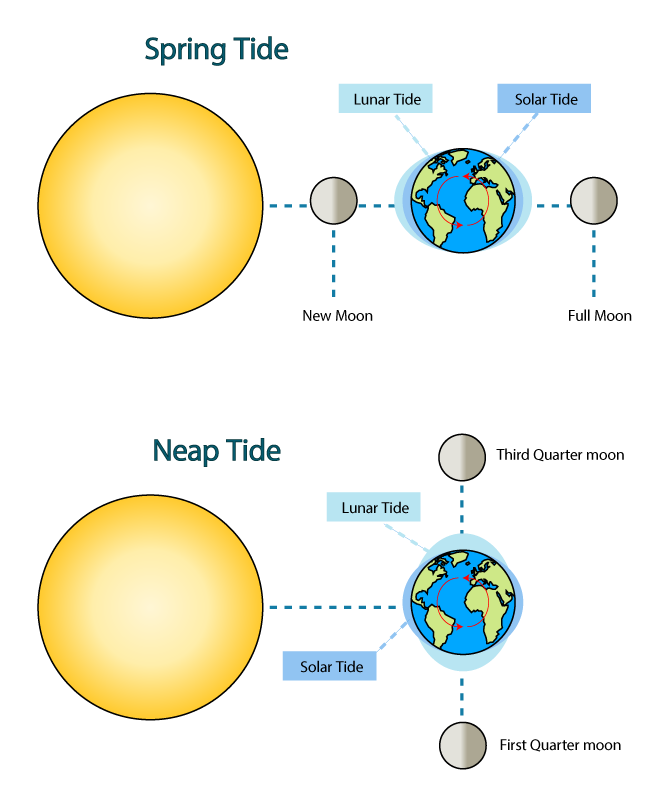
In the simplest of terms, the tides are just changes of water level on the planet that occur as a result of the two objects that are constantly pulling on the planet: the Sun and the Moon.
|
|
For more information about tides, click the button below. There is a helpful article that further explains the natural phenomenon.
EEn.1.1.3 Explain how the sun produces energy which is transferred to the Earth by radiation.
|
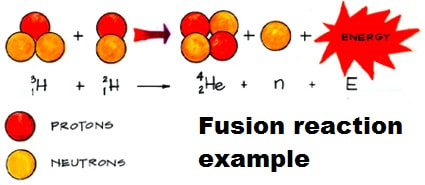
Fusion v. Fission
The Sun makes the energy that it sends to the solar system through nuclear fusion. Fusion occurs when two small nuclei are forced together to make a larger atom. This process releases a GREAT AMOUNT of energy! Nuclear fission is the opposite of fusion and involves a large unstable atom that breaks into smaller atoms. It also releases energy. Its energy can be harnessed by humans and controlled by nuclear power plants to power cities. This DOES NOT happen in the Sun. |
|
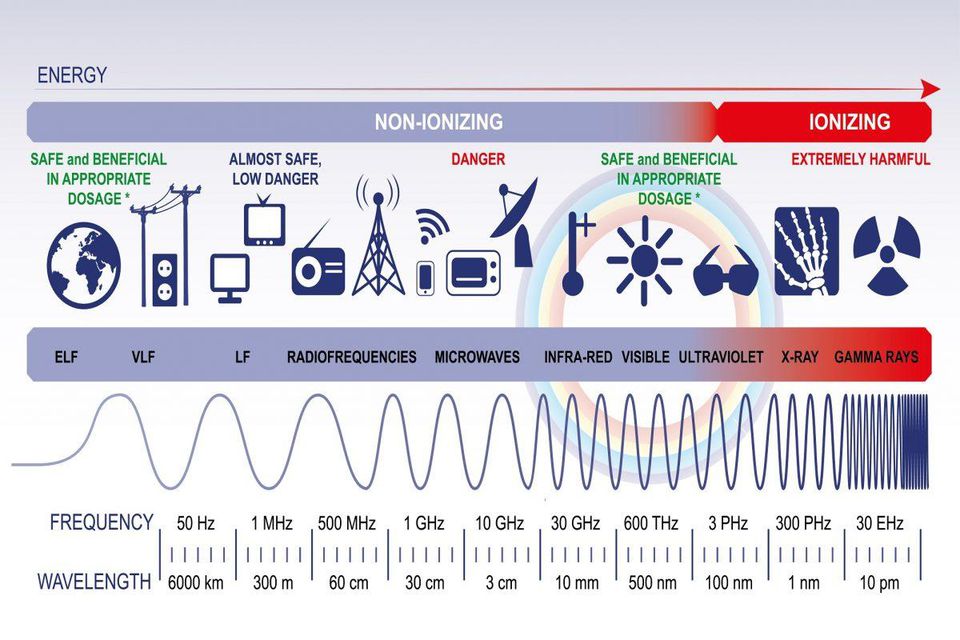
Several types of energy are released from the sun; some are useful and some are dangerous (and some are both).
5. X-Rays: can be used to see inside the body for medical reasons; dangerous 6. Gamma radiation: (highest frequency, lowest wavelength): Most dangerous of all the radiation; kills all cells exposed |
EEn.1.1.4 Explain how incoming solar energy makes life possible on Earth.
|
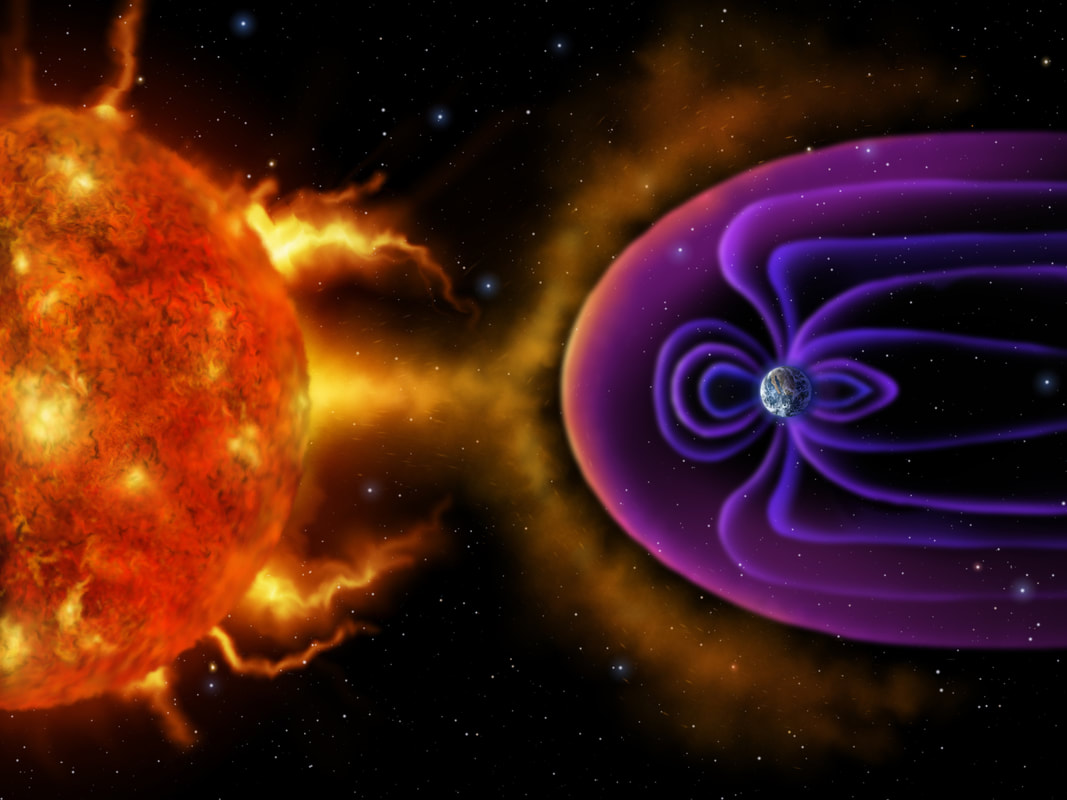
Without the energy from the sun, life on Earth would not be possible.
Energy travels more than 90 million miles from the Sun to get to the Earth. This energy is in the form of electromagnetic radiation and does not need matter in order to travel--which is good, because space is mostly matter free! All of the energy that comes from the Sun is not particularly helpful to life on Earth. Thankfully, it has a few shields around it to protect living things from the most harmful radiation.
|
|
|
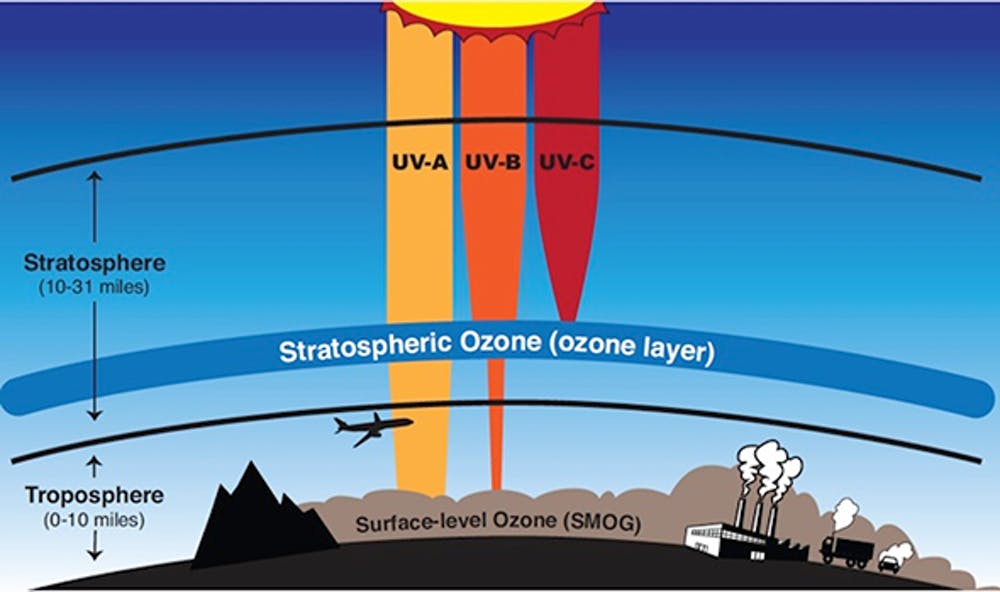
The visible light and infrared rays that make it to the surface of the planet is essential for providing life with the energy that it needs to survive.
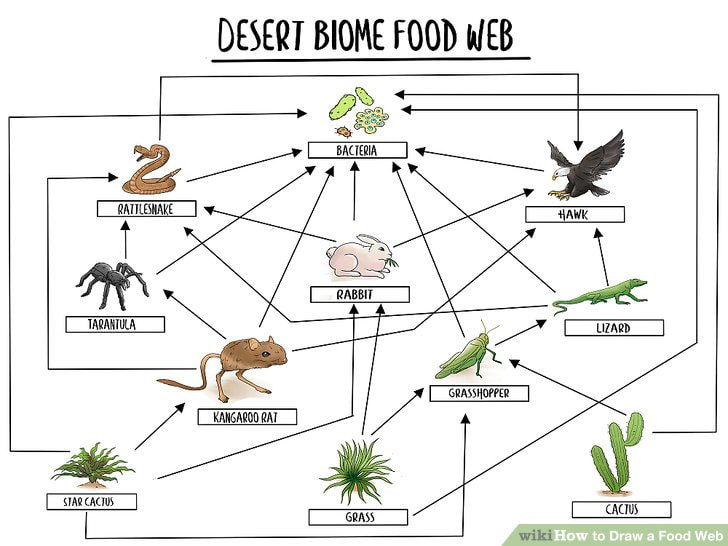
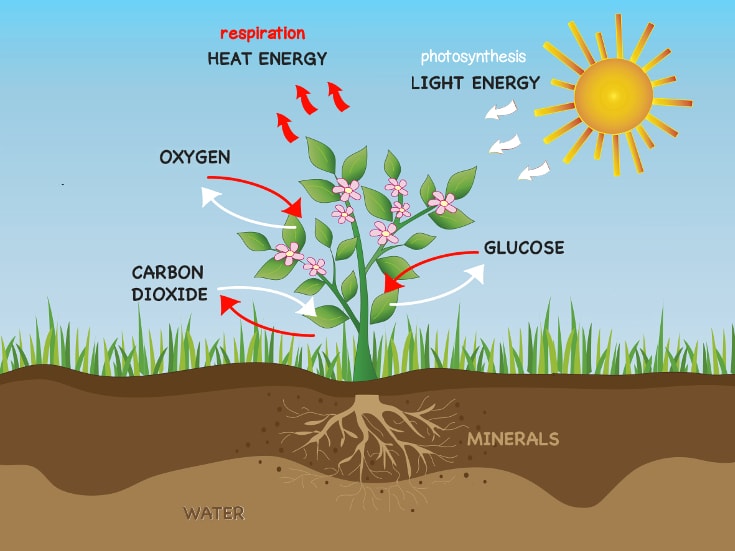
>The visible light makes photosynthesis possible. During photosynthesis, light energy is transformed into chemical energy as plants and other producers (algae, cyanobacteria) absorb the light and turn it into sugars (glucose). Other organisms (consumers) eat the sugars and get the energy they need to carry out their daily activities. We call follow the flow of energy through an ecosystem by examining food webs. >The infrared radiation that makes it to the Earth provides us with the heat to make the planet livable. Other planets are too hot or too cold to support life (that we know of) because of the amount of infrared radiation present on them. |
|
Unit 2: The Earth's Atmosphere
EEn.2.5.1 Summarize the structure and composition of our atmosphere.
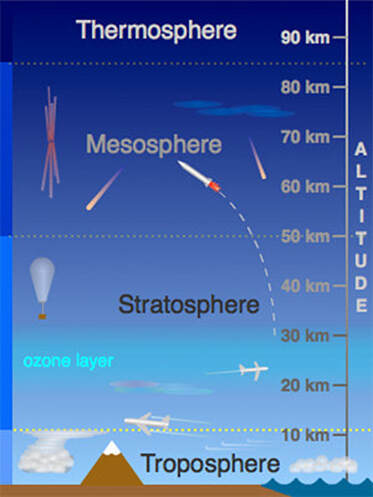
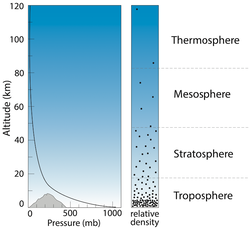
The atmosphere is made of six main layers: 1) troposphere, 2) stratosphere, 3) mesosphere, 4) thermosphere, 5) exosphere, and 6) ionosphere.
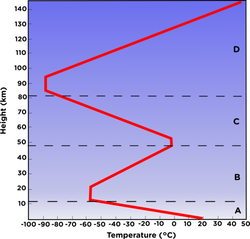
Troposphere: closest layer to the planet; it's where we live! Also, weather happens here. Temperature falls as elevation rises.
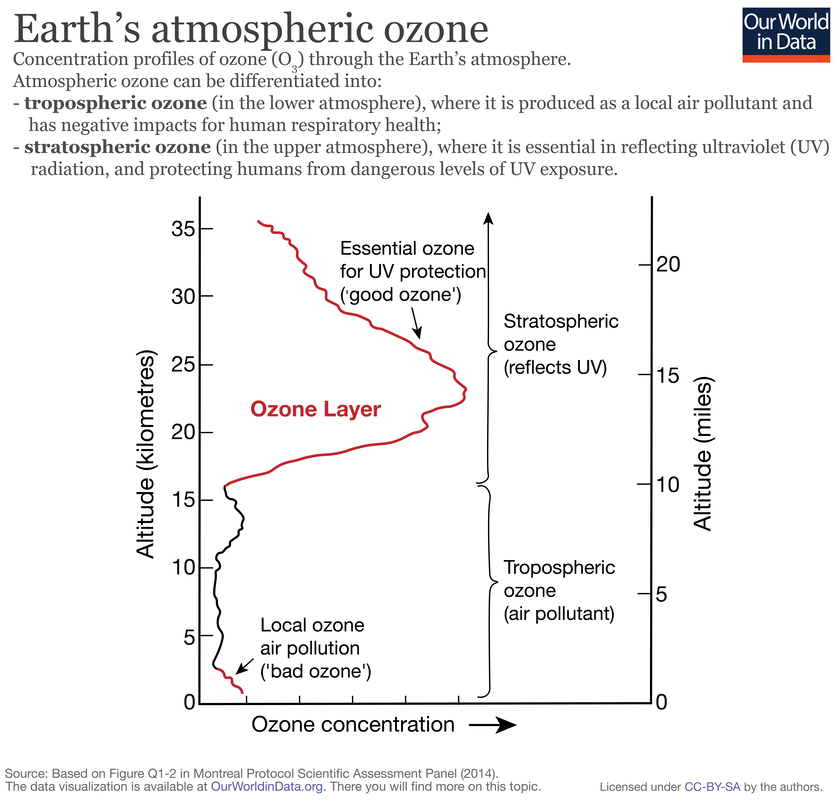
Stratosphere: 2nd layer of the atmosphere; planes fly here because they can get away from the turbulence caused by the weather; the ozone layer is also here. Temperature rises as elevation rises.
Mesosphere: 3rd layer of the atmosphere; meteors burn up in this layer of the atmosphere; it is also the coldest layer of the atmosphere. Temperature falls quickly as elevation rises.
Thermosphere: 4th layer of the atmosphere; The International Space Station (ISS) is found here. Temperature increases as elevation increases.
Exosphere: 5th layer of the atmosphere; satellites often orbit around the Earth in this layer
Ionosphere: Layer of the atmosphere that stretches across the mesosphere, thermosphere, and exosphere. Made of charged particles that glow when they absorb energy. The aurora borealis (Northern lights) and the aurora australis (Southern lights) happen in this layer as the energy from the sun is absorbed by the ions floating here, but you can only see them in areas near the Arctic and Antarctic Circles.
The edge of space is often represented at around 100 km above the surface of the planet (because more than 99.99997% of all of the matter in the atmosphere is found below this line).
Source: HERE
Troposphere: closest layer to the planet; it's where we live! Also, weather happens here. Temperature falls as elevation rises.
Stratosphere: 2nd layer of the atmosphere; planes fly here because they can get away from the turbulence caused by the weather; the ozone layer is also here. Temperature rises as elevation rises.
Mesosphere: 3rd layer of the atmosphere; meteors burn up in this layer of the atmosphere; it is also the coldest layer of the atmosphere. Temperature falls quickly as elevation rises.
Thermosphere: 4th layer of the atmosphere; The International Space Station (ISS) is found here. Temperature increases as elevation increases.
Exosphere: 5th layer of the atmosphere; satellites often orbit around the Earth in this layer
Ionosphere: Layer of the atmosphere that stretches across the mesosphere, thermosphere, and exosphere. Made of charged particles that glow when they absorb energy. The aurora borealis (Northern lights) and the aurora australis (Southern lights) happen in this layer as the energy from the sun is absorbed by the ions floating here, but you can only see them in areas near the Arctic and Antarctic Circles.
The edge of space is often represented at around 100 km above the surface of the planet (because more than 99.99997% of all of the matter in the atmosphere is found below this line).
Source: HERE
Analyzing Graphs Related to the Atmosphere:
Graph 1
Graph 2
Graph 3
Graph 4
Graph 5
Graph 6
Graph 7
EEn.2.5.2 Explain the formation of typical air masses and the weather systems that result from air mass interactions.
Air Masses
Air masses are large bodies of air that form over specific areas of the planet.
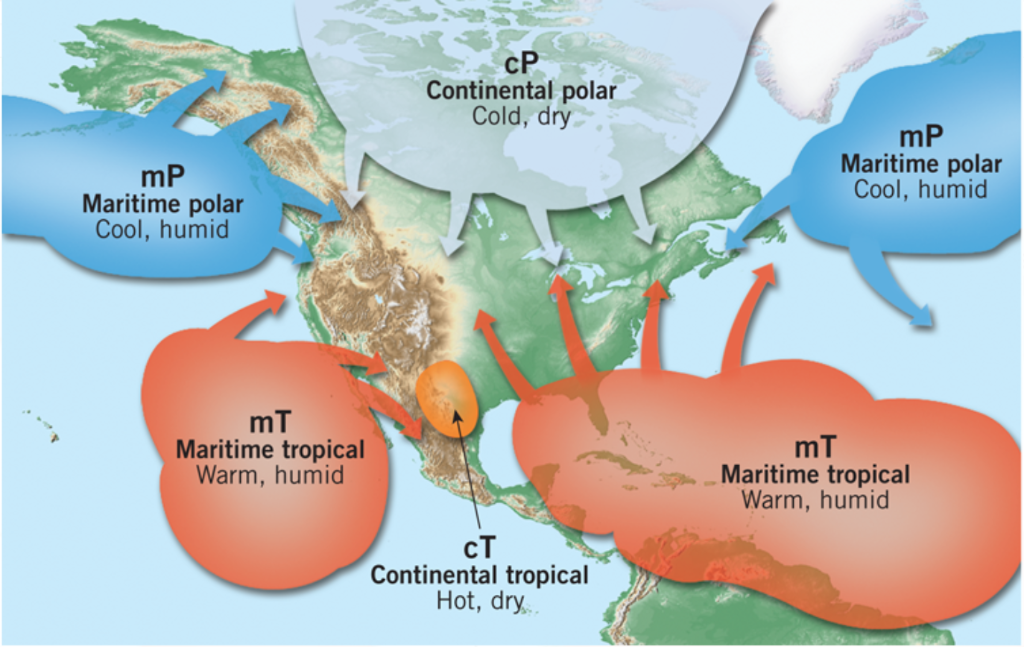
Depending on where the air masses form, they can be four different types:
*cP: continental polar (dry and cold)
*cT: continental tropical (dry and hot)
*mP: maritime polar (moist and cold)
*mT: maritime tropical (moist and hot)
Air masses are large bodies of air that form over specific areas of the planet.
Depending on where the air masses form, they can be four different types:
*cP: continental polar (dry and cold)
*cT: continental tropical (dry and hot)
*mP: maritime polar (moist and cold)
*mT: maritime tropical (moist and hot)
|
Pressure Systems
Weather is controlled by the movement of pressure systems across the world. There are two types of pressure systems: high and low. High Pressure Systems High pressure systems push air down and away from the center. In the Northern Hemisphere, high pressure systems blow air outward in a clockwise motion and are called anticyclones. >High pressure systems are known for generating clear weather because clouds cannot form when the air is constantly being pushed down. Low Pressure Systems Low pressure systems suck air in and lift the air upward. In the Northern Hemisphere, low pressure systems pull the air inward in a counterclockwise motion and are called cyclones. >Low pressure systems are known for bad weather--storms, precipitation, and high winds. |
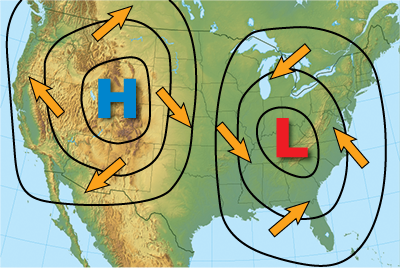
Air moves out from high pressure systems toward low pressure systems and that helps to generate the global winds on Earth.
>Because of this flow of air, our weather typically moves from West to East across the United States. |
EEn.2.5.3 Explain how cyclonic storms form based on the interaction of air masses.
|
Where air masses come together, they create fronts.
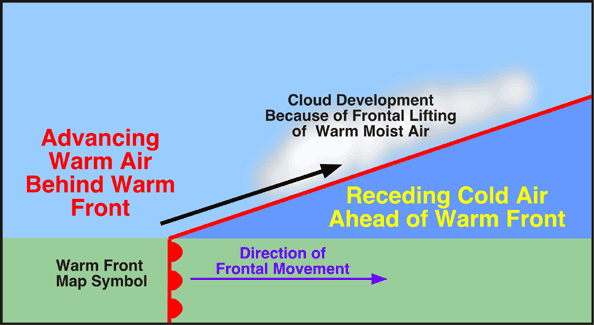
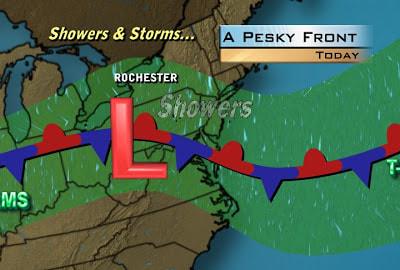
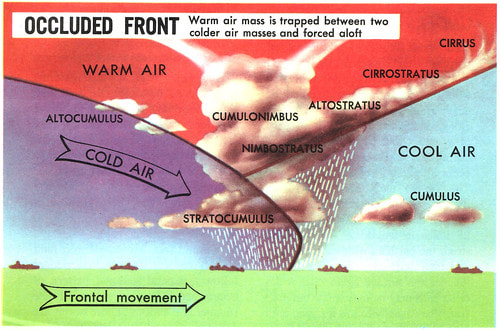
There are four kinds of fronts: warm fronts, cold fronts, stationary fronts, and occluded fronts. 1) Warm fronts *areas where warm air masses crash into cooler air masses and slowly climb over the cold air mass warming them up. This causes calm rain to form over the regions. Warm fronts move slowly and are represented on weather maps by a line of red semicircles. Temperatures increase when warm fronts pass through the area. 2) Cold fronts *areas where cool air masses overtake warm air masses and push the warm air upward in a steep slope. This can cause thunderstorms and heavier precipitation than warm fronts. Cold fronts move quickly and are represented on weather maps by a line of blue triangles. Temperatures decrease when cold fronts pass through the area. 3) Stationary fronts *areas where cool air and warm air converge, but don't have the energy to move against each other. Usually this results in behavior similar to a warm front and days of rain showers occur until the front can move again. Stationary fronts are represented on weather maps by a line of blue triangles and red semicircles on opposite sides of the line. Temperatures usually increase after they pass through the area. 4) Occluded fronts *areas where a cold front overtakes a warm front and forces the warm air upward violently. Usually this makes for unstable weather and severe storms can result from it. Occluded fronts are represented on weather maps by a purple line of triangles and semicircles on the same side of the line. Temperatures usually decreases after they pass through the area. |
|
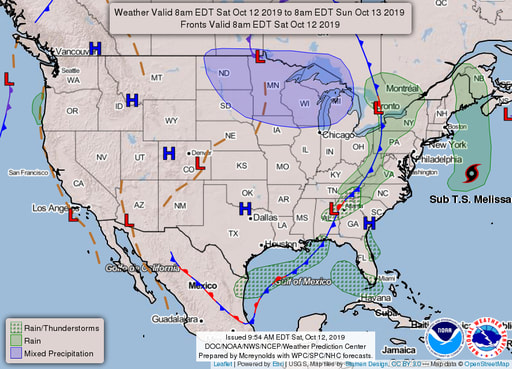
EEn.2.5.4 Predict the weather using available weather maps and data (including surface, upper atmospheric winds, and satellite imagery).
|
|
Weather represents the atmospheric conditions NOW and is often presented to us daily on news networks to show us what we can expect at the moment and over the next few days based on what is happening around the country. Using maps that show us pressure systems and fronts, we can predict what the weather will be like within a given week.
|
Global winds are generated by high and low pressure systems that occur along certain lines of latitude on Earth. They help to push large air masses along and keep fronts forming.
Remember air rises at the FALLS at HIGH pressure areas and then moves toward LOW pressure areas where it is lifted. This cycling of the air in a loop creates the global winds. *In general, weather moves across the US from WEST to EAST, so we can look at what is happening in the midwest (Kansas and Nebraska) to figure out what we should be seeing in a few days. *To get to us in Eastern NC from the midwest, weather must cross our mountains (the Appalachians) and that typically weakens strong systems and prevents us from experiencing a great deal of the severe weather (like supercell thunderstorms and tornadoes) that people in Kansas and Nebraska see often. |
|
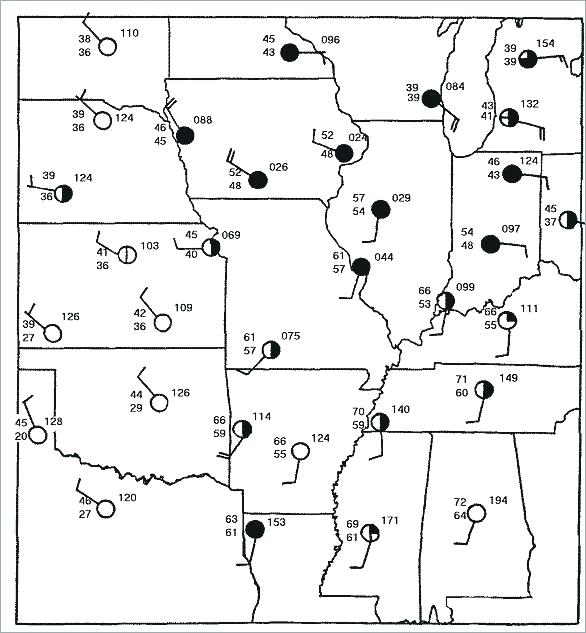
Notice the numbers on the left side of the weather station. They represent the temperature and dew point for the area. The temperature is pretty important because it lets you know what to wear when you are going outside. The dew point is the temperature at which water in the atmosphere will condense dew to humidity and pressure. Higher dew points make conditions feel damp and uncomfortable outside--especially in the summer.
|
We can use and interpret weather station drawings to figure out what the weather is like in a certain area. These drawings are a collection of symbols and numbers that provides us with information needed to understand the big picture of what the weather is doing in a particular place.
Look at the map of weather stations on the right. You can see a variety of circles around the map that look empty, filled, or partially filled. These circles represent the cloud cover in that place. Empty circles represent clear areas and filled circles represent totally cloudy places. Any shading (one fourth, one half, three fourths) in between shows you that cloudiness could be scattered clouds, partly cloudy, or mostly cloudy in the area.
Connected to those circles are branched lines. These branches represent wind speed and direction. The main branch points to the direction the wind is coming from. If you look at the weather station closest to the bottom right corner of the image, you see that the wind is coming from the southwest. If you look at the weather station in the top right corner, the wind is coming from the east. The side branches show you how fast the wind is blowing. The bottom right station has winds at 10 knots. The top right station has winds at 15 knots. (Long lines represent 10 knots, short lines are 5 knots.) Triangles, if they are on the branch represent 50 knots and are usually only present if a hurricane or severe storm is in the area! [Every 7 knots is about 8 miles per hour.] |
The numbers on the right side of the weather station represent the air pressure. Normal air pressure is between 950-1050 mb. The numbers are displayed in abbreviated form on the maps. The bottom right weather station shows 194, but the pressure is actually 1019.4 mb. The top right weather station that says 154 is really 1015.4 mb. Pressures around 1010 mb or lower usually mean poor weather conditions. During hurricanes and severe thunderstorms, pressures in the 900s can be observed. Between 1010-1020 mb, you can have showers or calm weather. Above 1020 mb, and you usually experience fair weather conditions.
|
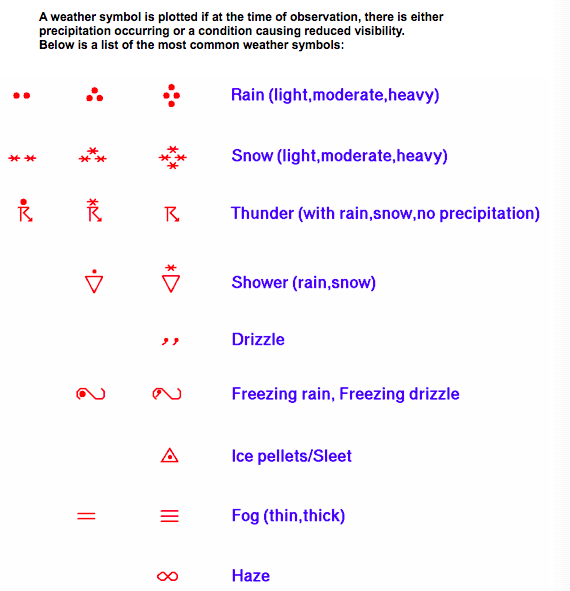
You don't see them on this particular weather map, but in the bottom left corner of some weather stations, you will occasionally see symbols that show what kind of weather is happening at the station.
The picture on the right shows the variety of symbols that could be drawn in that spot and tells what each of them represents. 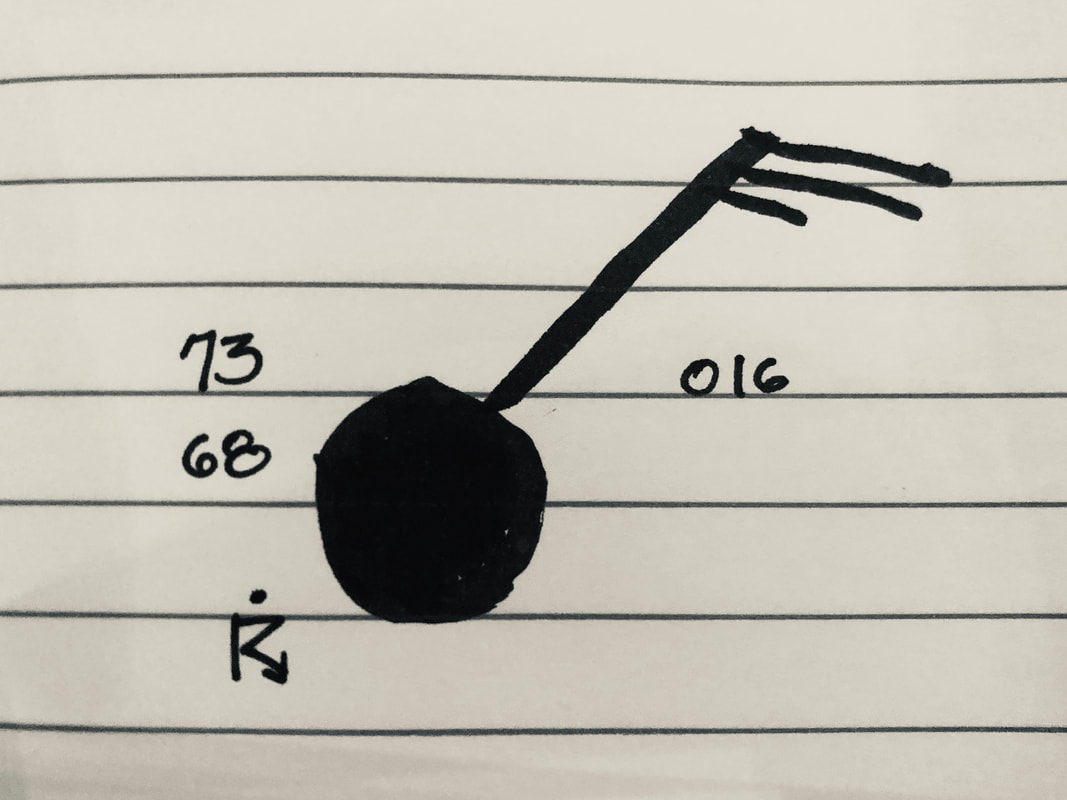
What is happening in the location represented by the weather station in this picture?
|
|
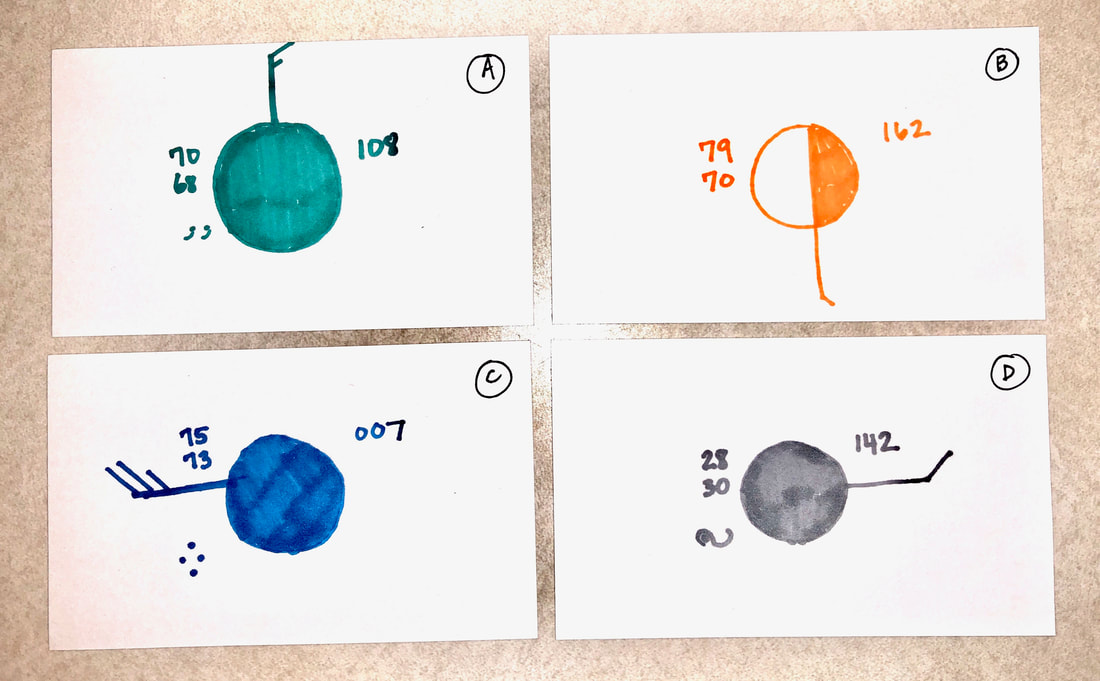
Here are some more examples of weather station models. See if you can figure out what the weather is like in each of these locations!
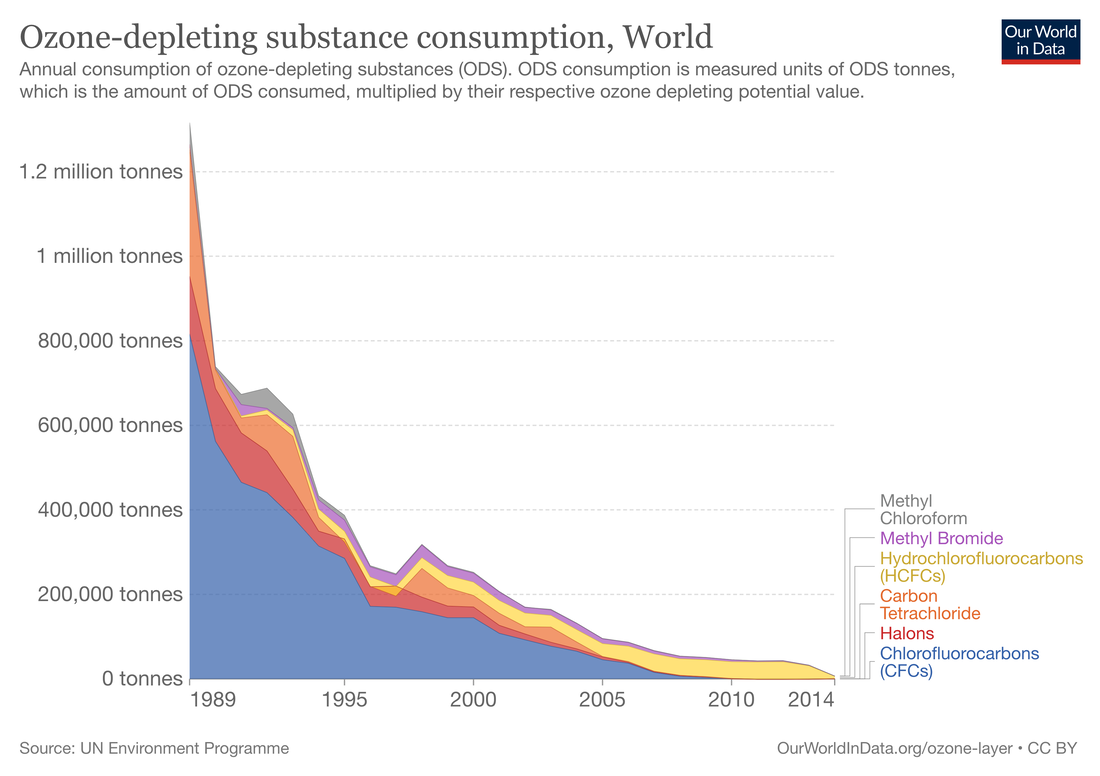
EEn.2.5.5 Explain how human activities affect air quality.
The links below tell how humans typically affect the air around us and contribute to atmospheric pollution. Read through them carefully and take notes of your own!
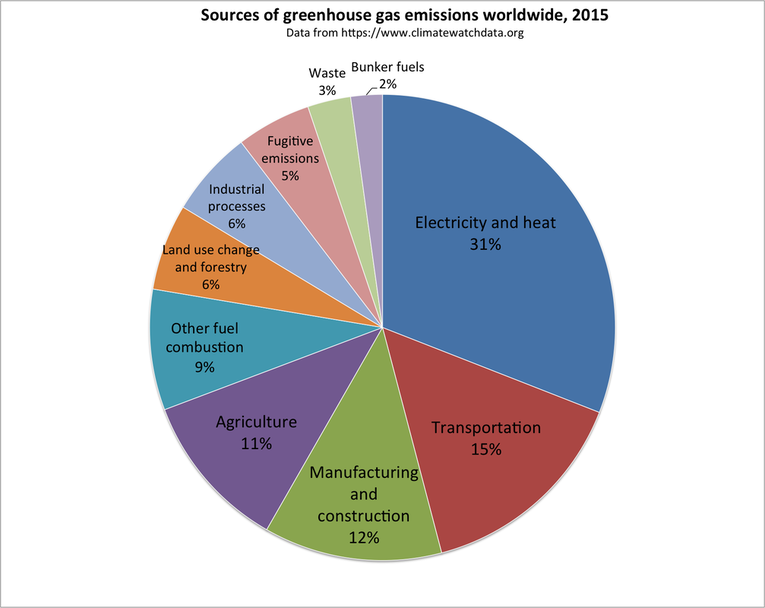
When we look at the bigger picture, what are we doing to affect the climate (longterm patterns of weather)?
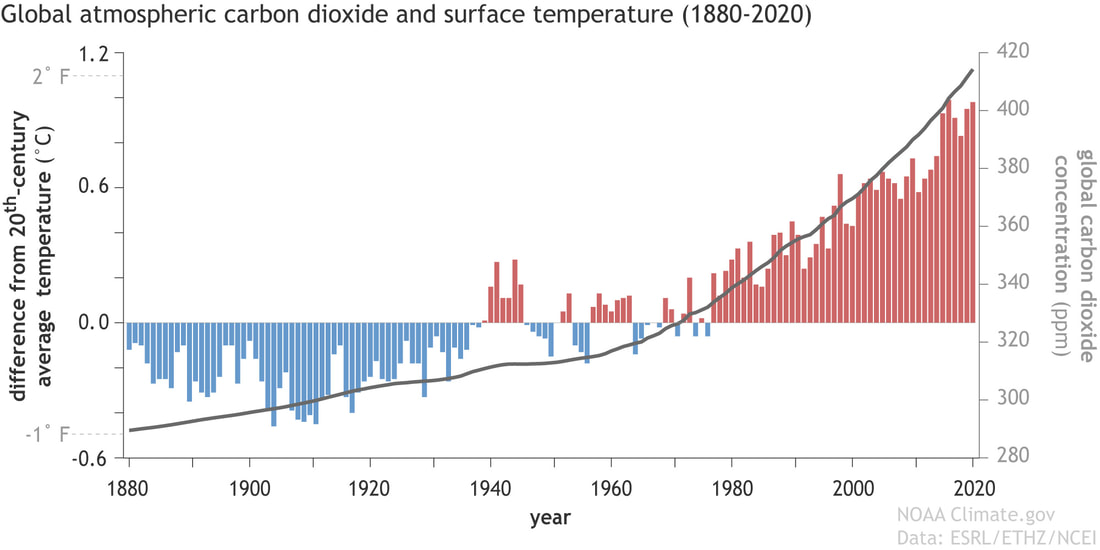
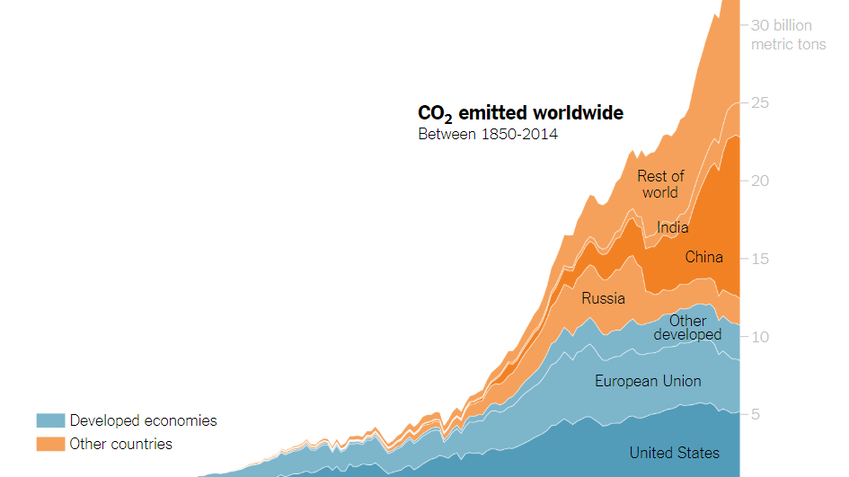
*The most important focus is on rising average global temperatures. The link below will give you information about what gases contribute to this abnormal increase in global temperatures. Read through it and take some notes of your own!
*The most important focus is on rising average global temperatures. The link below will give you information about what gases contribute to this abnormal increase in global temperatures. Read through it and take some notes of your own!
Why should we care about rising global temperatures?
1) Increased average temperatures make life more uncomfortable for not only us, but also other animals across the planet.
2) The increased average temperatures are causing ecosystems to change and habitats to be destroyed or incapable of supporting the animals that need certain conditions to survive.
3) Increased average temperatures are causing icecaps and glaciers to melt at faster rates than normal, which causes rising sea levels and an increased frequency in the flooding of coastal lands.
4) Warmer average temperatures results in an not only an increase in the number of severe weather events in the form of tropical storms, but also stronger storms, that are capable of doing significant damage across the planet.

Look at the graph above. It shows the last 140 years and the amount of Carbon Dioxide in the atmosphere vs. the change in average temperature. What pattern do you notice?
How can we solve this problem of too much Carbon dioxide in the atmosphere?
1) Plant more trees. Trees (and other plants) take in CO2 from the atmosphere during photosynthesis.
2) Use alternative energy sources. Coal, petroleum, and natural gas are all fossil fuels that put CO2 into the atmosphere when they are burned. If we can push for the use of alternative energy, we can potentially lower the amount of CO2 getting put into the atmosphere.
>Alternative energy sources include: Wind energy, Hydroelectric energy, Geothermal energy, Nuclear energy, and Solar energy.
>For transportation, research is being done to make fuel for cars and planes out of crops and plant waste materials after fields are plowed (biofuels).
>We can also just use less energy. Turn off lights when you aren't in the room. Open windows to heat and cool houses instead of constantly running heaters and air conditioners. Walk or bike instead of driving everywhere.
3) Research and development of materials that could absorb atmospheric CO2. Construction materials are being created that trap CO2 in the materials (which helps to take it out of the atmosphere).
4) Reduce, Reuse, Recycle. Reducing the amount of new materials we have to extract from the Earth will lower our dependence on fossil fuels. Reusing items that we have (cell phones) instead of having to go out and buy a new one just because it exists will help lower the fossil fuel burden as well. Recycling the materials we have already used in manufacturing can also help to lower the need we have to use fossil fuels to obtain more resources.
Unit 3: The Earth's Hydrosphere
EEn.2.3.1 Explain how water is an energy agent (currents and heat transfer).
|
The density of ocean water helps to drive the motion of the water around the globe.
>>>The density depends on two factors: 1. salinity (how much salt is dissolved in the water) 2. temperature The overall trend of the motion of the ocean is that warmer water from the equator moves toward the poles. |
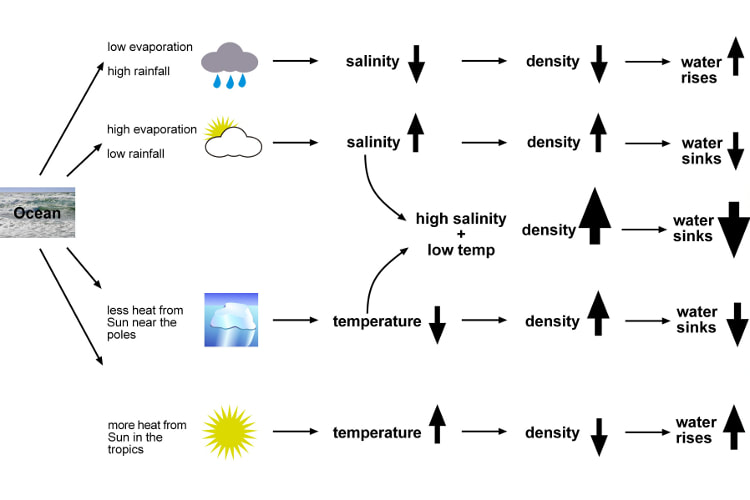
When ocean water is more dense, it sinks. When ocean water is less dense, it expands (rises). This generates the motion that moves the water around the planet.
|
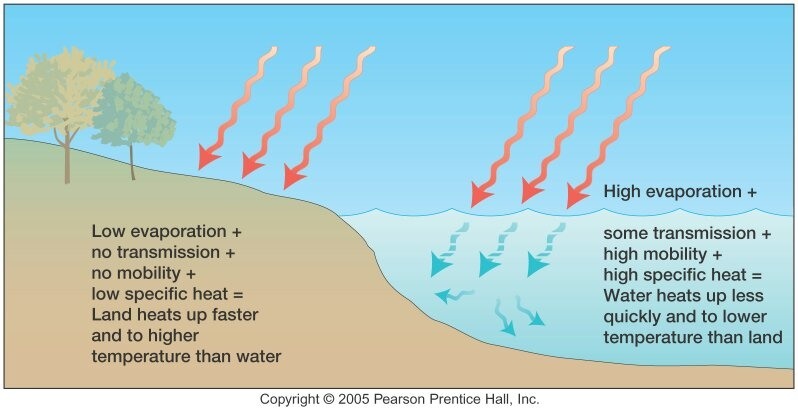
When we think about how the ocean affects the temperatures of coastal areas and inland regions, we have to think of the impact of the large body of water based on its high specific heat. (It takes LOTS of energy to change the temperature of water--so water is very likely to hold its temperature much easier than land).
The take away:
1. Coastal areas don't experience a great change in temperature during the day because the ocean helps the area hold its temperature. 2. Inland areas have a bigger temperature swing during the day because the land heats up/cools down much faster than water does. |
|
EEn.2.3.2 Explain how ground water and surface water interact.
|
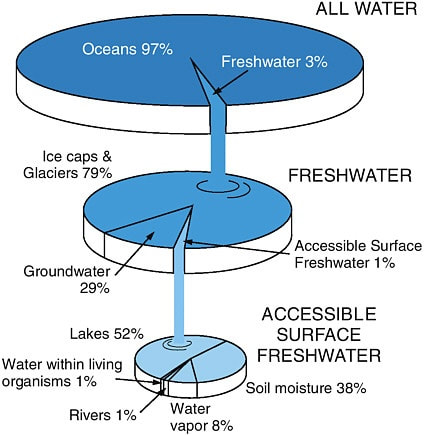
When we think of the distribution of water on Earth, we must realize:
72% of the surface of Earth is covered by water. >Out of all the Earth's water, 97.5% of the water is saltwater. >Out of the 2.5% of the water on Earth that is freshwater: --Most of the freshwater is trapped in ice caps and glaciers. --We have less than 1.0% available for us to use! *MOST of the usable water on Earth is used in AGRICULTURE! *Industry uses the second highest amount. *In third place, is domestic use (drinking, washing dishes, laundry, showers and baths, toilets). |
|
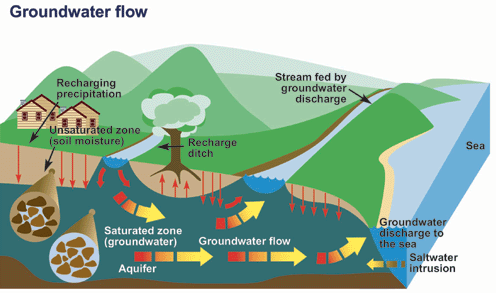
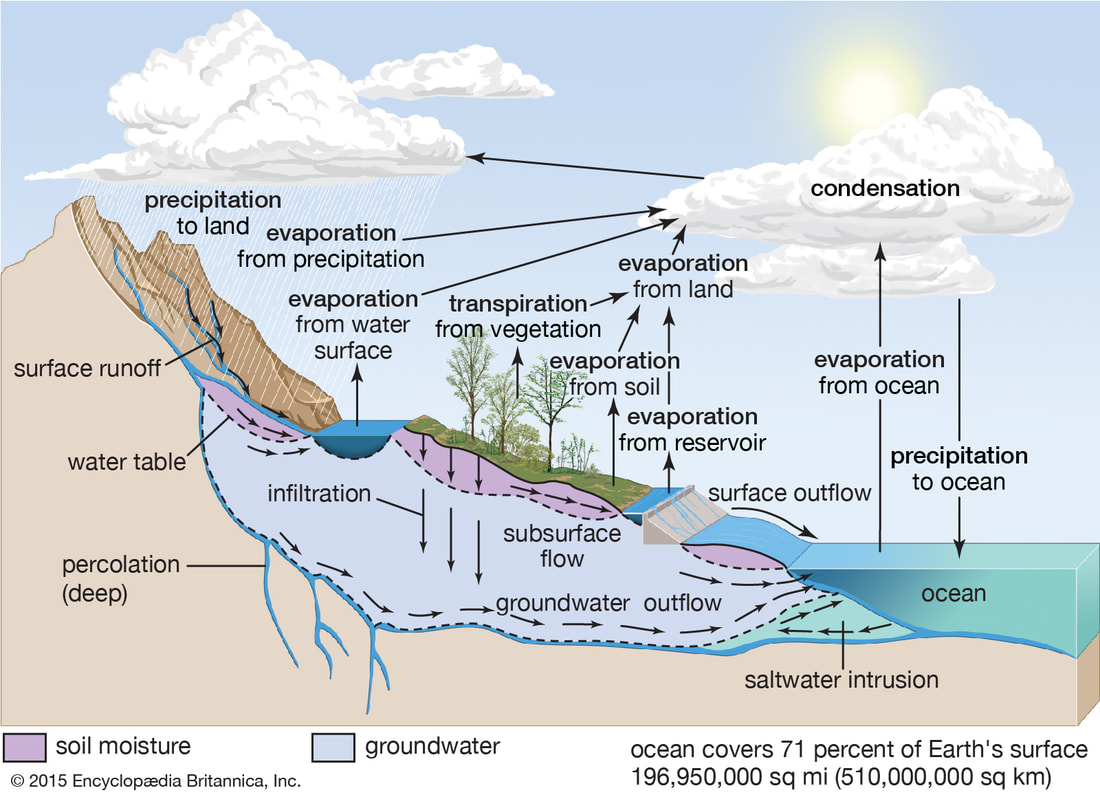
Surface water and groundwater have an interesting relationship.
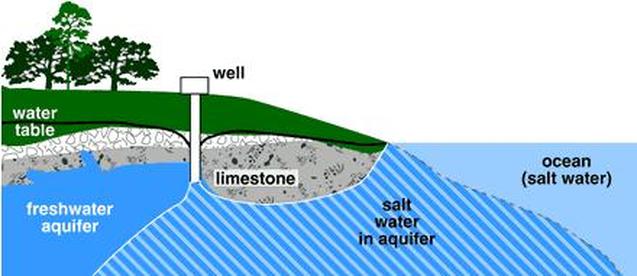
Groundwater is recharged when infiltration is high. Water flows downward through the soil and rock due to gravity and fills pores between the particles. In areas where all of the pores are filled with water, the ground is saturated (zone of saturation). Areas where the open spaces still contain air underground are unsaturated (called the zone of aeration). The line that divides the zone of saturation and zone of aeration is called the water table. >If the water table is high, precipitation can cause flooding because the water has no place to go but across the surface. >If the water table is low, precipitation can infiltrate into the soil. The rock that holds groundwater is called an aquifer. >Aquifers must be both porous and permeable. -Porous means there are open spaces in the rock layer. -Permeable means that water can travel through the rock layer because the pores are connected. >BUT for an aquifer to be useful, the base of the aquifer must be impermeable, so the water will be able to build up within the rock layer. |
|
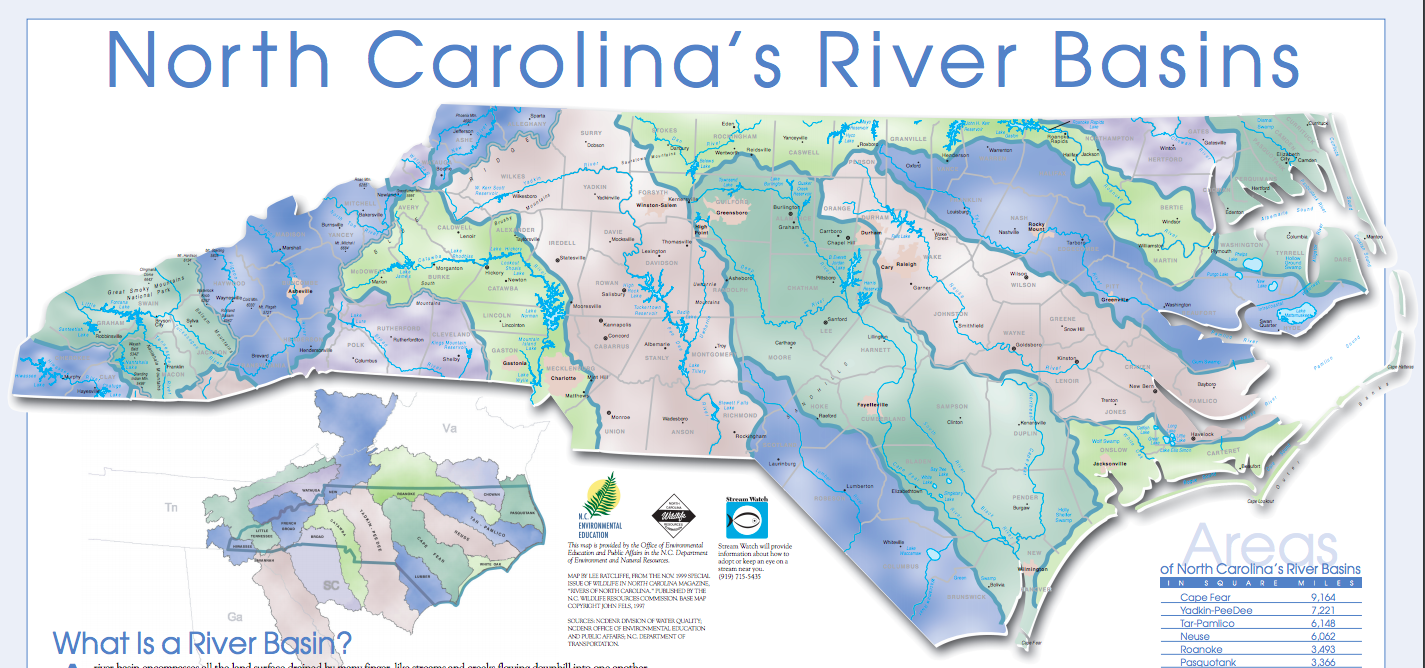
Many river basins exist throughout North Carolina. It is useful to remember some terms when it comes to river basins:
>River basins: areas that drain into certain rivers
>Source: beginning of a river (usually found in the WEST)
>Mouth: end of a river (usually found in the EAST)
North Carolina's river basins flow toward the Atlantic Ocean in one way or another. MOST NC river basins flow EAST and empty directly into the Atlantic Ocean in one of the sounds. However, SOME NC river basins are blocked by the Appalachian Mountains and flow south and west toward the Mississippi River where their waters eventually empty into the Gulf of Mexico.
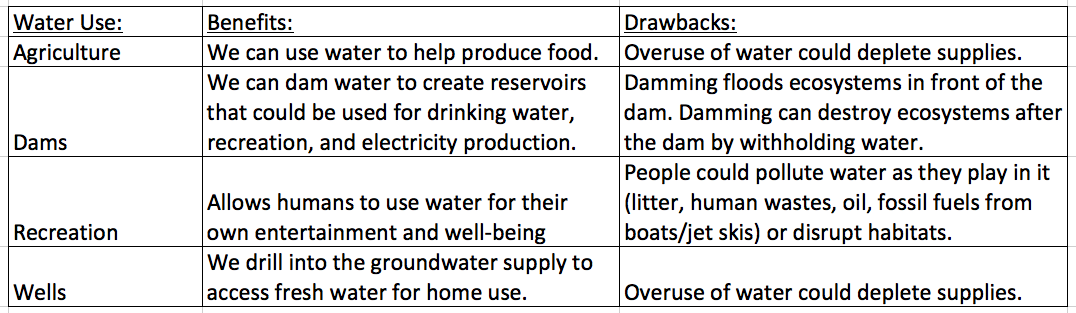
EEn.2.4.1 Evaluate human influences on freshwater availability.
|
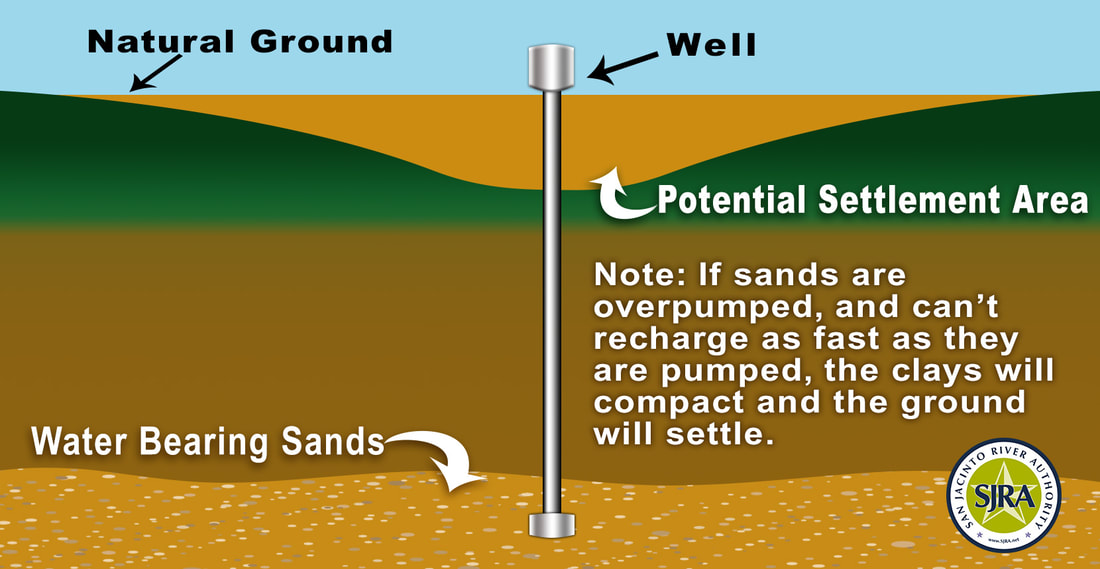
Aquifer Depletion
When we overuse aquifers, they can get depleted (emptied). Agriculture (Farming) uses the most freshwater and is the biggest threat to depleting aquifers so we must be careful when we use irrigation to water fields. Two major risks of aquifer depletion are: 1. Land subsidence: the sinking of the land (sinkholes) that occurs when the pore that usually hold water are empty (just air). The weight of the land causes the ground to cave inward. 2. Salt water intrusion: the backflow of salt-water into aquifers that occurs when the water table is lower than the level of ocean water. If saltwater enters the aquifer, it can contaminate it and make it useless for irrigation and for drinking. |
|
|
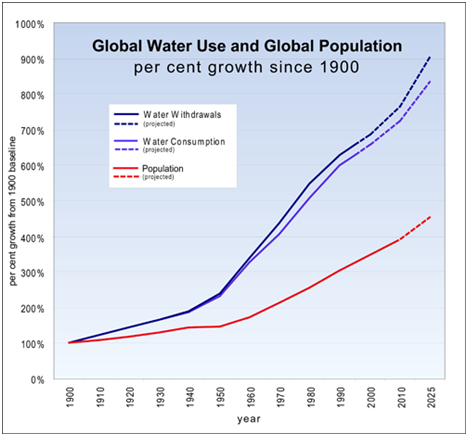
How does human population growth affect water resources?
--MORE PEOPLE = MORE WATER USE --As population continues to grow, water resources for people will become more scarce. --In places that are already facing frequent droughts, growing populations increase the chances that the humans that live in those locations are going to go without water! |
|
>>>Hey you in 4th Period! Today is April 5, 2022! Your assignment is HERE!
Pollution and Water Availability
Water pollution can render a supply of water useless.
Water can be polluted by:
1. Biological hazards: bacteria, protists, viruses, animal wastes: can be dangerous to human health
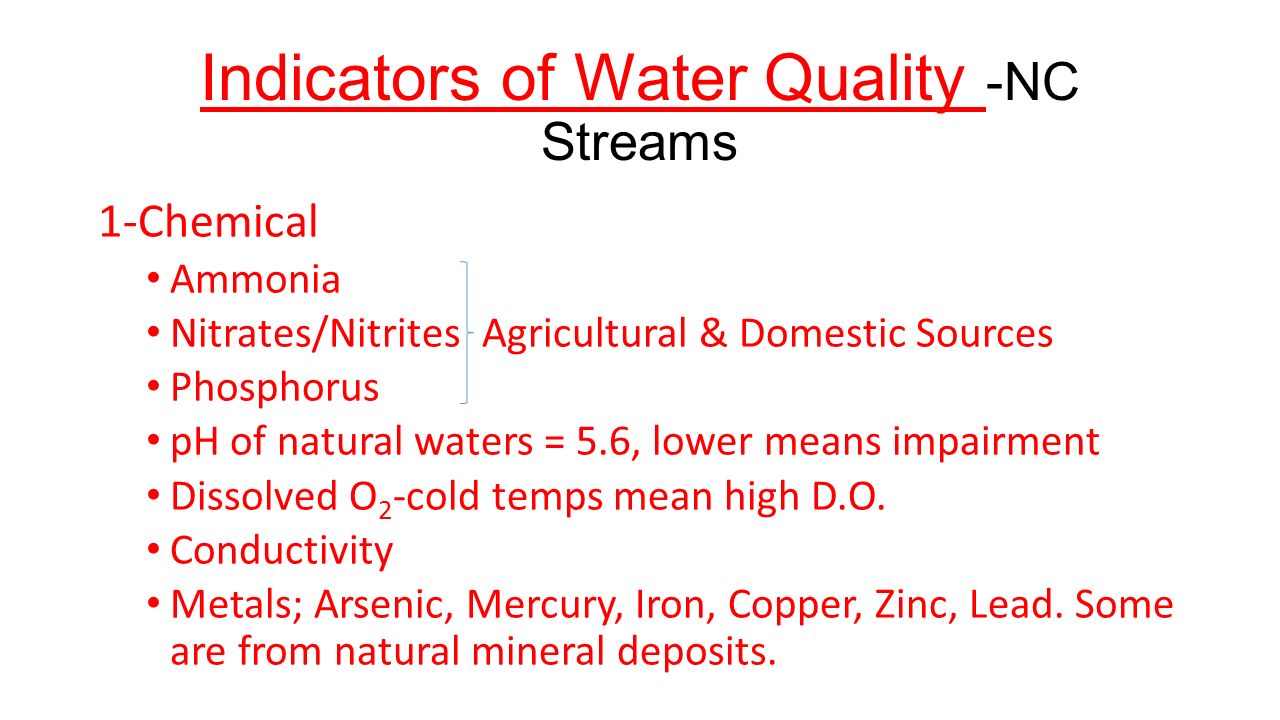
2. Chemical hazards: many chemicals can kill sensitive aquatic organisms or make their way into the food web; this could affect human health
3. Physical hazards: trash and other contaminants can make water dirty (ex: litter, plastics)
4. Sediments: can make the water cloudy and block sunlight for aquatic plants
Contaminants can spread through surface waters in times of flooding or in the regular flow of rivers and streams or ponds and the ocean. Contaminants in surface waters can be cleaned faster than contaminants in groundwater because groundwater moves so slowly.
Water pollution can render a supply of water useless.
Water can be polluted by:
1. Biological hazards: bacteria, protists, viruses, animal wastes: can be dangerous to human health
2. Chemical hazards: many chemicals can kill sensitive aquatic organisms or make their way into the food web; this could affect human health
3. Physical hazards: trash and other contaminants can make water dirty (ex: litter, plastics)
4. Sediments: can make the water cloudy and block sunlight for aquatic plants
Contaminants can spread through surface waters in times of flooding or in the regular flow of rivers and streams or ponds and the ocean. Contaminants in surface waters can be cleaned faster than contaminants in groundwater because groundwater moves so slowly.
EEn.2.4.2 Evaluate human influences on water quality in North Carolina’s river basins, wetlands and tidal environments.
Unit 4: Geology--The Solid Earth
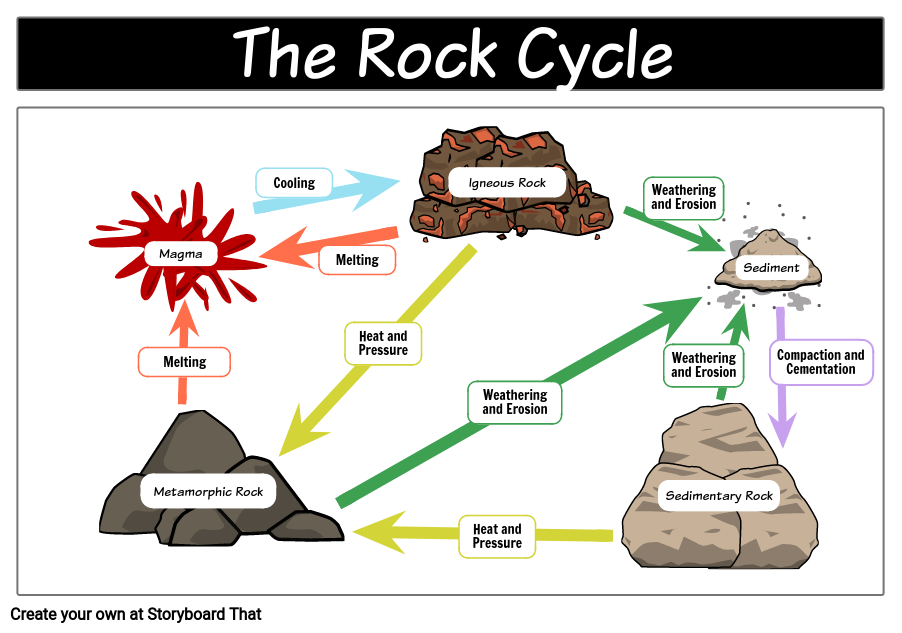
Mining is one way humans impact the rock cycle. Click HERE to access an article about Mining's Effects on the Environment.